Website Builder Statistics Every Founder Should Know in 2026
Website builder statistics are easy to misread because the market is growing fast while the installed base remains very uneven. Mordor Intelligence estimates the category at USD 3.57 billion in 2026, rising from USD 3.06 billion in 2025 and reaching USD 7.67 billion by 2031 at a 16.58% CAGR (Mordor Intelligence website builders market report). That headline sounds simple, but it hides the central question founders need answered: which builder segment is growing, who is buying it, and whether the sites it produces truly perform.
Table of Contents
- Why Website Builder Statistics Matter in 2026
- How to Read Website Builder Market Size Numbers
- The WordPress Factor That Reshapes Every Comparison
- Inside the AI Website Builder Boom
- The Performance Gap Most Statistics Ignore
- Who AI Website Builders Actually Serve
- Turning the Statistics Into a Builder Decision
- Three Takeaways That Change How You Read Future Builder Statistics
Why Website Builder Statistics Matter in 2026
The reason website builder statistics matter in 2026 is simple, they separate a crowded market into usable signals. A market that reached USD 3.57 billion in 2026 is not a fringe category, and the projection to USD 7.67 billion by 2031 shows that buyers are still choosing packaged site creation over custom builds in meaningful numbers (Mordor Intelligence). That matters whether you're choosing a platform, benchmarking a competitor, or trying to understand where the next round of product innovation is headed.
The four lenses that actually help
Good analysis starts by splitting the category into four questions. First, how big is the overall market. Second, how fast is the AI subsegment growing. Third, how well do builder-generated sites perform. Fourth, who is adopting these tools, first-time founders or established businesses.
The market mix matters too. In the same Mordor Intelligence report, cloud deployment accounted for 81.08% of revenue in 2025, North America held 38.25%, and the business segment represented 57.35% of market size (Mordor Intelligence). Those aren't trivia points. They tell you that website builders are being bought as business infrastructure, not only as hobby tools.
Practical rule: treat every builder statistic as a lens, not a verdict. A growth chart tells you momentum. A performance metric tells you quality. A segment split tells you who the product is really serving.
The rest of the data in this space makes more sense once you keep those three ideas separate. A platform can grow quickly and still have weak technical output. A segment can dominate new signups without touching the broader web. A market can expand while the installed base outside the dominant CMS ecosystem barely moves. That's the core story behind the headline numbers.
How to Read Website Builder Market Size Numbers
A market size figure looks precise, but it usually measures revenue, not how many websites exist. The USD 3.57 billion in 2026 estimate from Mordor Intelligence is useful because it shows commercial demand, yet it doesn't mean builders now define the majority of the web (Mordor Intelligence). That distinction matters because revenue can rise faster than site count when vendors add premium tiers, add-ons, hosting, or AI features.
What the market data captures, and what it misses
The easiest mistake is to read “market size” as “total adoption.” That's too broad. The market data usually captures paid builder revenue, bundled subscriptions, and enterprise plans, while custom development, unpaid open-source usage, and many hybrid stacks sit outside the frame. That's why a market valuation should be read as commercialized builder spend, not as a census of every website on the internet.
The regional and deployment splits are more revealing than they first look. Cloud deployment held 81.08% of revenue in 2025, which suggests buyers prefer hosted convenience over self-managed complexity (Mordor Intelligence). North America's 38.25% share points to concentration in a mature buying market rather than universal global symmetry. And the business segment's 57.35% share tells you the category's strongest commercial use is already linked to revenue-bearing sites, not only personal projects.
The linked perspective from the AI builder market is similar. A 25.8% CAGR through 2033 sounds dramatic, but it describes a projection, not a current installed base (Market.us AI-powered website builder market). Read it as momentum, not dominance.
This AI builder market-share view is useful precisely because it reminds you to separate growth projections from actual footprint.
A high CAGR often means the category is still catching up from a smaller base. It does not automatically mean the category already dominates real-world site creation.
If you're evaluating a builder vendor, ask two questions before you trust the headline. What exactly is being counted, and what sits outside the definition. If the answer is fuzzy, the number is probably better at attracting attention than guiding a purchase decision.
The WordPress Factor That Reshapes Every Comparison
Any serious reading of website builder statistics has to start with WordPress, because WordPress still anchors the web in a way most builder comparisons skip. WordPress powers over 43% of all websites and held 61.4% of the CMS market in a 2025 summary citing W3Techs, while its ecosystem includes over 65,000 plugins and tens of thousands of themes (WordPress.com market share summary). That makes the category much messier than “builder versus builder.”
Why builder comparisons get distorted
WordPress is not just a website platform, it's a base layer for layered builds. A site may use WordPress with a page builder, WordPress with custom theme work, or WordPress with ecommerce tooling such as WooCommerce. That changes the meaning of “market share” because the visible front end and the underlying CMS are not always the same thing.
WooCommerce matters here too. The same WordPress summary says it is used by about one-third of online shops, and a 2026 roundup places it at 35% of active ecommerce websites as of February 2025 (WordPress.com market share summary). That means many commercial sites are not choosing between a standalone builder and a blank slate. They're choosing between one layer of WordPress tooling and another.
The cleaner benchmark for direct platform comparison is the market share of builders excluding WordPress and Shopify, where builders collectively power about 10% of all websites in one 2026 market summary (Colorlib website builder market share). That figure is smaller, but it is more honest when you want to compare pure builder products against one another.
Built-For vs Open-Source Builder Footprint
| Category | Share of web | Notable examples |
|---|---|---|
| Open-source CMS foundation | Over 43% | WordPress |
| CMS market share | 61.4% | WordPress |
| Ecommerce shop usage | About one-third, with a 2026 roundup putting WooCommerce at 35% of active ecommerce websites | WooCommerce on WordPress |
| Builder platforms excluding WordPress and Shopify | About 10% | Wix, Squarespace, Duda, similar hosted builders |
WordPress stack detection context matters because a lot of apparent “builder adoption” is really a mixed stack under the hood.
The strategic takeaway is uncomfortable but useful. If you compare a hosted builder to WordPress without separating CMS foundation from front-end builder, you'll overstate the builder's independence and understate WordPress's role. That's why the web still looks more open-source than vendor dashboards would make it seem.
Inside the AI Website Builder Boom
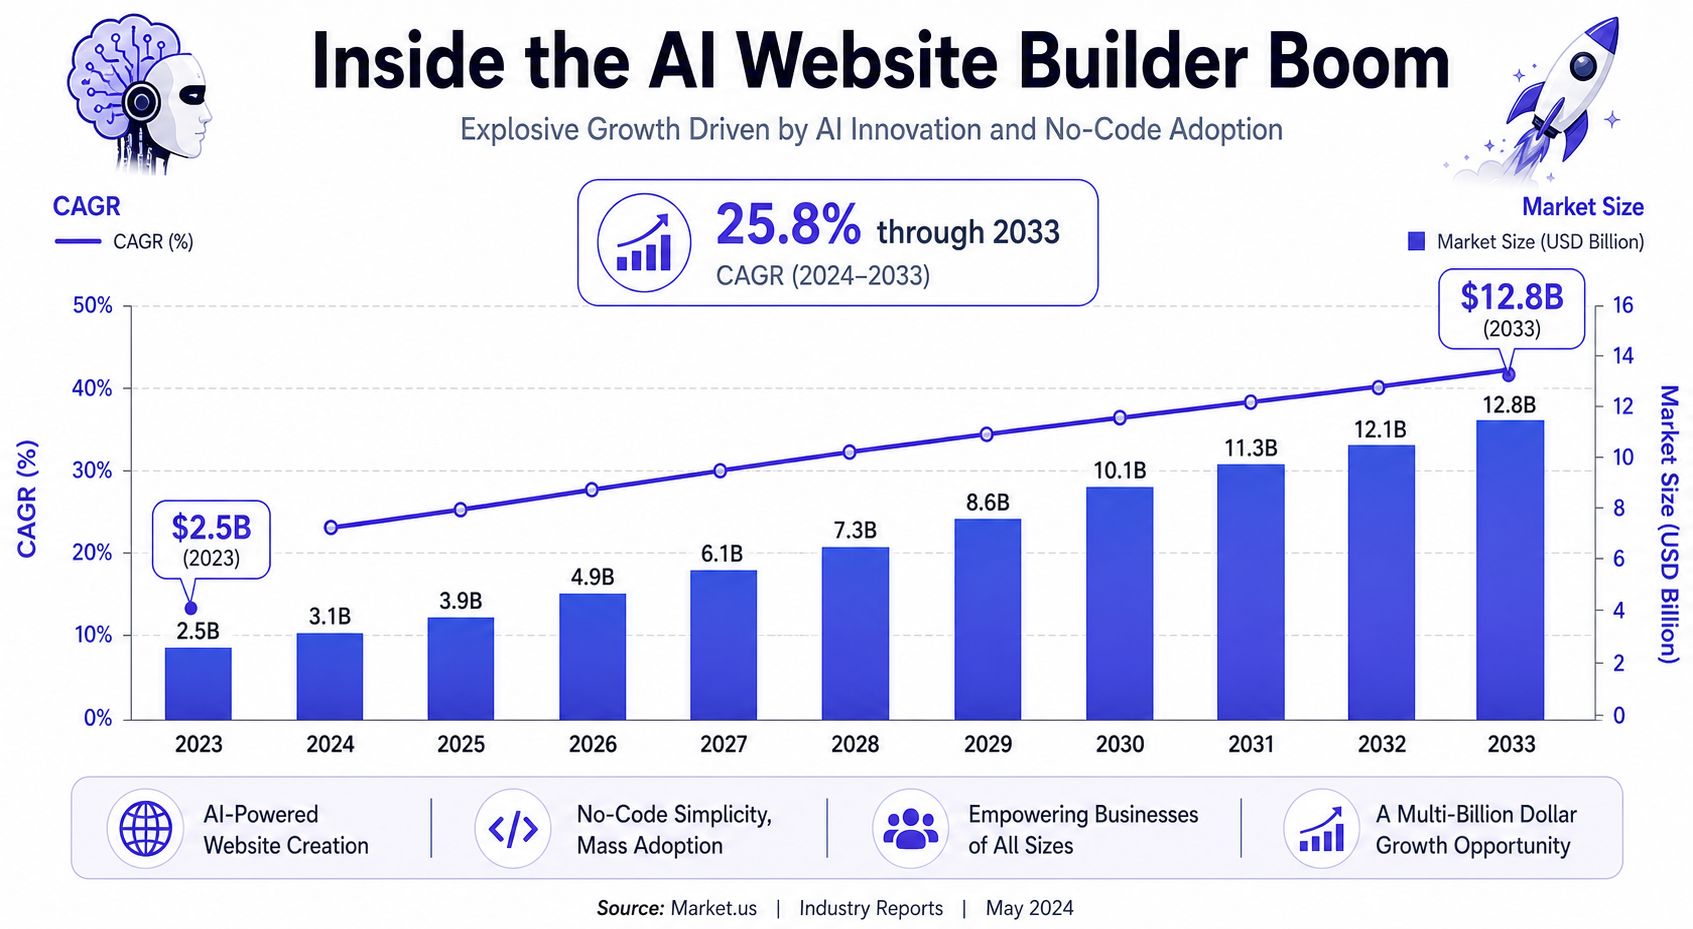
The AI builder segment is where hype and evidence drift apart fastest. One market forecast places the AI-powered website builder market at about USD 3.17 billion in 2023 and USD 31.5 billion by 2033, a 25.8% CAGR (Market.us AI-powered website builder market). Another estimate says the market reached USD 3.24 billion in 2026 after a 20% year-over-year increase from 2025, which confirms the category is expanding quickly rather than settling into maturity (Market.us AI-powered website builder market).
Growth is not the same as installed base
The number that gets buried most often is the share of the total market. One 2026 summary says AI-based builders represented 23.6% of the total website builder market in 2024, up from 11% in 2022 (Hostinger AI website builder statistics). That is a sharp rise, but it is still a minority position inside the broader builder universe.
That distinction changes the headline. “AI builders are taking over” describes trajectory. It does not describe dominance. A fast-moving slice of a bigger category can still remain secondary to entrenched platforms, especially when the underlying web is still anchored by WordPress and its ecosystem.
AI websites detection context helps because it lets you check whether a site really uses an AI-first stack, rather than assuming the label from the landing page.
Why the category keeps expanding
Part of the draw is operational. One 2026 market summary says AI-driven creation can cut production time by 70% and reduce the learning curve from 4–8 hours to about 15 minutes (Colorlib website builder market share). Those figures explain why nontechnical buyers are adopting AI-assisted setup so quickly.
But speed is only one side of the story. The market is expanding because AI builders reduce the friction of starting, not because they automatically outperform older systems. That's why the next question should always be, what kind of site gets produced once the builder finishes the first draft.
The Performance Gap Most Statistics Ignore
The hardest numbers to find in builder coverage are often the most important. One 2026 analysis says AI-generated sites account for about 8% of new launches, but only 29% pass Core Web Vitals, compared with 42% overall and 61% for hand-coded sites (Digital Applied website statistics 2026 facts and trends). That doesn't mean AI builders are broken. It means speed of creation and technical quality are different outcomes.
Quality varies by platform, not just by label
Among standalone builders, the spread is wide. The same 2026 market summary reports that Duda has the strongest Core Web Vitals pass rate at 85%, while Wix sits at 71% to 75%, Squarespace at 68%, and WordPress around 43% to 45% (Colorlib website builder market share). It also notes a mobile Lighthouse performance score of 57 for Duda versus 64 for Wix, which shows that one builder can lead on one metric without leading on another.
That is the part most vendor pages gloss over. The label “AI builder” says almost nothing by itself. What matters is the implementation pattern, the code weight, and the degree to which the site is optimized after launch.
Practical rule: if a builder advertises faster setup, ask for technical proof on the finished site, not a promise about the first draft.
The broader contrast is useful for marketers, too. A builder can create more sites faster, but that doesn't guarantee those sites are better at discovery, accessibility, or conversion. Performance still needs to be measured, not inferred from the signup flow.
For teams that want a different kind of practical benchmark, resources like voice AI for support teams can be useful as a reminder that AI product claims should be evaluated by deployment quality, not just by feature lists. The same logic applies to builders.
What the data really says
The category-level story is not “AI equals worse.” It's more precise than that. The data shows a spread between builders, a spread between AI-generated and hand-coded sites, and a spread between launch speed and live performance. If you only read adoption numbers, you miss the technical cost of convenience.
That gap is where many purchase mistakes happen. Founders often optimize for faster launch, then discover that slower pages or weaker technical structure make later marketing more expensive. The market is still teaching buyers that convenience is not free.
Who AI Website Builders Actually Serve
The cleanest signal in the AI builder market is not raw growth. It's who is buying. Hostinger reports that 93% to 95% of Horizons users are first-time website builders with no prior paid web presence (Hostinger AI website builder statistics). That's a very different buyer profile from a company migrating away from a custom stack or an established CMS.
First-time founders and established businesses live in different markets
A first-time founder usually wants a site live quickly, with enough structure to test demand. An established business often wants control, integrations, and long-term portability. The adoption pattern in Hostinger's data says AI builders are strongest at converting people who had no site at all, not necessarily at replacing mature systems.
The same source says 58% of small businesses now use generative AI, while about 1 in 3 small businesses still lack a website (Hostinger AI website builder statistics). That combination matters. It suggests the largest opportunity is still basic digitization, not wholesale platform replacement.
This is why AI builder adoption can look explosive while the web itself changes more slowly. A tool that converts non-owners into site owners can post strong growth without immediately displacing the installed base of WordPress, Shopify, or custom frameworks. That's a different commercial motion, and it deserves to be treated as such.
The buyer intent gap
One 2026 summary says AI-based builders made up 23.6% of the total website builder market in 2024, up from 11% in 2022 (Hostinger AI website builder statistics). Read that against the first-time user data and a clearer picture emerges. The category is expanding because it lowers the barrier to a first site, not because every established business is switching stacks.
That matters for founders comparing products. If you already have content operations, analytics, and ecommerce workflows in place, the median AI builder user may not look much like you. If you're starting from zero, the same builder can solve a much more immediate problem.
Turning the Statistics Into a Builder Decision
Statistics become useful only when they change the way you choose. For a first-time founder, the most relevant numbers are the ones tied to ease of launch and buyer fit. For a marketer, the most relevant numbers are market share, adoption mix, and performance benchmarks. For an engineer or analyst, the value sits in stack evidence, not marketing copy.
A simple decision filter
Start with the market question. If a vendor frames itself as the category leader, check whether the claim refers to the whole market, the AI subsegment, or only a hosted-builder subset. That difference matters because the web is still dominated by WordPress, and a standalone builder's footprint can look much larger or smaller depending on what gets excluded.
Next, check the performance question. Core Web Vitals, Lighthouse, and technical stack fingerprints tell you more about the likely outcome than a feature carousel does. A platform with strong growth can still ship mediocre pages, and a platform with modest growth can still produce technically stronger sites.
Then ask the adoption question. If a product's user base is mostly first-time builders, that product is solving a different problem than one used by mature businesses. The statistics only help if you match the segment to your own stage.
What AI Website Detector adds to the process
AI Website Detector is useful when you want to verify what a site is built on, not just what its owner claims. It identifies AI-first builders and CMS platforms, surfaces tech stack signals, and returns an evidence-based verdict with a confidence score and scan breakdown. That makes it practical for competitor research, portfolio checks, and vendor due diligence.
If the site you're studying looks polished but the stack is unclear, the stack scan often answers the question faster than a sales page does.
The point is not to chase every new tool. The point is to map the statistics to the decision in front of you. A first site, a redesign, a competitor analysis, and an engineering audit all require different evidence.
Three Takeaways That Change How You Read Future Builder Statistics
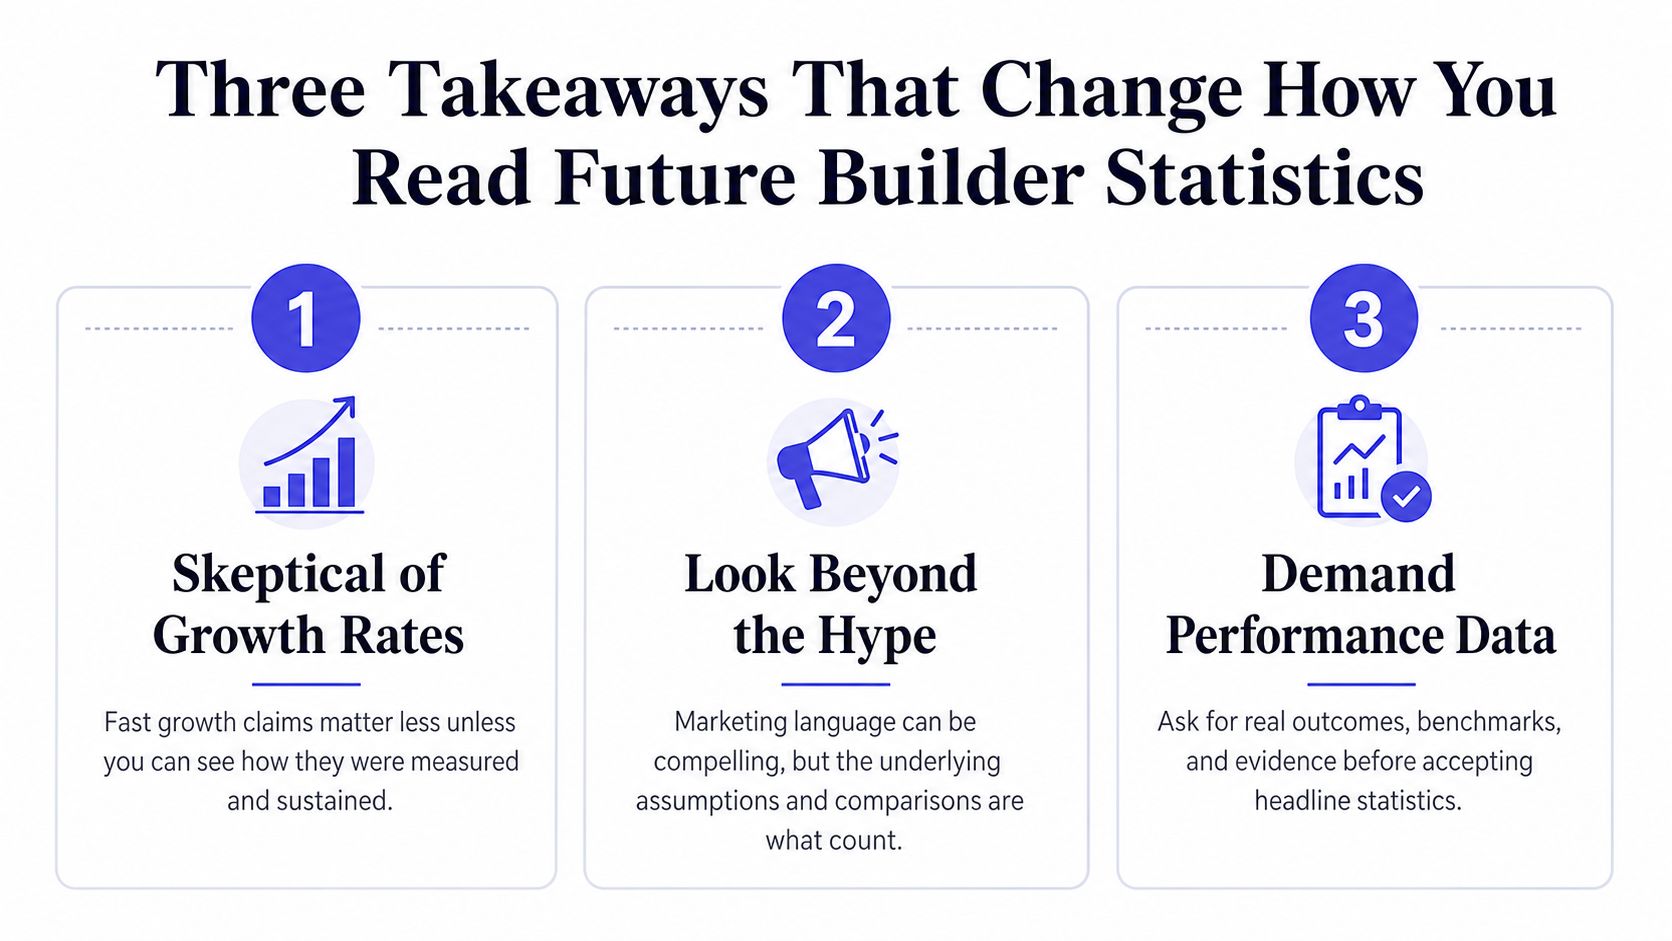
The first takeaway is to stop treating growth rate and installed-base share as interchangeable. A 25.8% CAGR through 2033 tells you the AI builder market is expanding quickly, but it does not tell you that AI builders already dominate the web (Market.us AI-powered website builder market). Growth is momentum. Share is ownership.
Keep segment, quality, and share separate
The second takeaway is that segment matters more than the category headline. First-time founders, small businesses, and established teams behave differently, and the adoption data shows those differences clearly. When 93% to 95% of Horizons users are first-time website builders, you are not looking at the same buyer pool as a company migrating an existing business site (Hostinger AI website builder statistics).
The third takeaway is that performance data deserves equal weight with adoption data. Core Web Vitals pass rates, Lighthouse scores, and technical fingerprints are the only way to tell whether a builder is producing convenient sites or competent ones. The spread from 85% for Duda to the low-to-mid 40s for WordPress in the builder summary is too large to ignore (Colorlib website builder market share).
When a vendor leads with speed, ask what the site looks like after launch. That answer is usually more useful than the signup pitch.
The broader lesson is that builder statistics are most valuable when they slow you down. They help you see whether a product is serving beginners, whether it's gaining share or just noise, and whether the output is technically solid. Read them that way and you'll avoid most of the traps that make vendor comparisons misleading.
If you want to check what a competitor or inspiration site is built with, visit AI Website Detector and scan the URL before you trust the marketing page. It shows the underlying tech stack, builder signals, and evidence behind the result, which makes it a practical next step for anyone comparing website builders, vendors, or rival sites.