
Component Identification: A Practical Website Detection
You're trying to work out what powers a site that looks polished on the surface, but the clues are scattered. The homepage says one thing, the scripts say another, and the cookies make you wonder whether you're looking at a CMS, a custom app, or a builder output wrapped in extra tooling. That's the reality of component identification on modern websites, and it's the same reason single-signal guesses fail so often.
Table of Contents
- Why Modern Websites Defeat Simple Detection
- The Signal Categories Behind Every Website
- Inspecting a Live Website Using Browser Tools
- Identifying Bundled Frameworks and AI-Generated Code
- Building Confidence Through Multi-Signal Verification
- Turning Detection Into Actionable Intelligence
Why Modern Websites Defeat Simple Detection
A lot of people start by looking for one obvious marker, a generator tag, a familiar CSS class, or a known script URL. That works on clean, older builds, and it falls apart fast on modern hybrid stacks where the visible site is only one layer of the delivery path. In practice, you'll often find a site that looks like one framework in the DOM, another in the bundles, and something else again once you inspect the edge behavior.
One site can wear several masks
That mismatch is normal now. A marketing site might render with a static shell, pull in third-party analytics at the edge, and still expose framework artifacts that don't match the visible page structure. The result is that a single marker can be misleading in either direction, especially when a build mixes custom code with component libraries and hosted assets.
Practical rule: if one signal is loud but the rest are quiet, treat it as a clue, not a verdict.
The historical lesson from electronics applies here too. Component identification matured because technicians stopped trusting one visual cue and started cross-checking the package, marking, and board context, just like board-level workflows that begin with silkscreen codes and then confirm with datasheets and databases from the circuit board components identification guide. Website stack work needs the same discipline.
A useful mental model is to think in layers. The outer layer is what the browser receives, the next layer is how the page was assembled, and the deeper layer is how the app behaves under load, routing, and hydration. If you want a broader framing of why that matters for business and engineering decisions, the discussion of website tech stack detection and why it matters is a good companion read.
The strongest identifications usually come from combining evidence categories, not from finding a single signature. That means headers, HTML, bundles, CSS conventions, network requests, and cookies all have a role, even when one or two of them are noisy.
The Signal Categories Behind Every Website
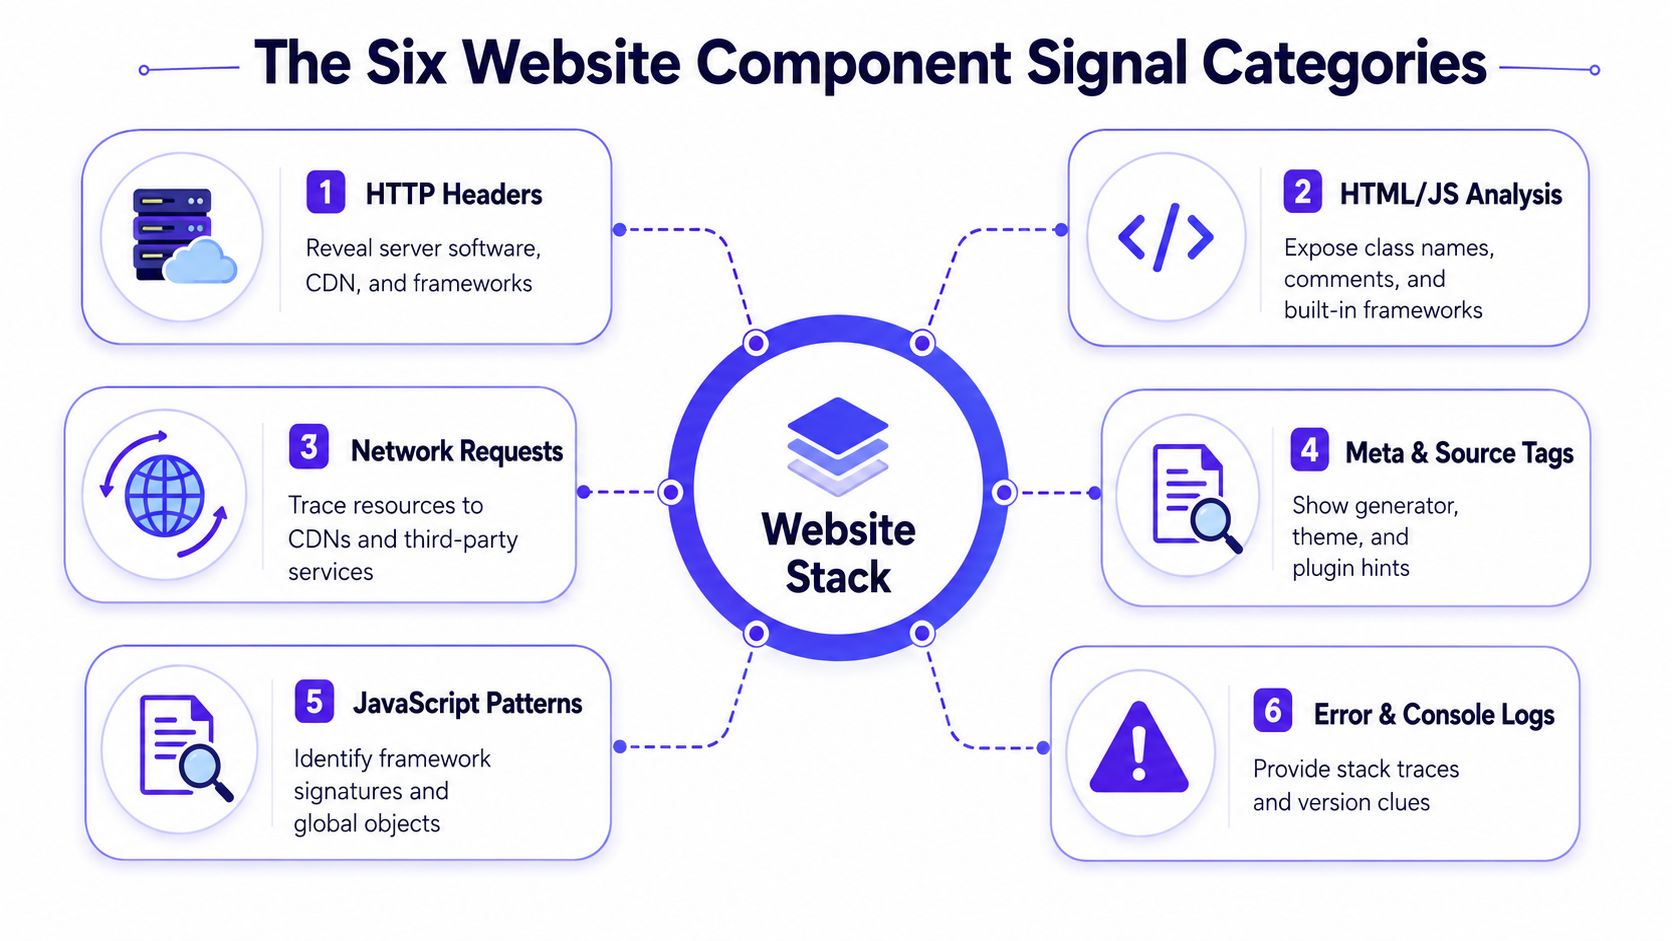
The fastest way to get better at component identification is to stop thinking in terms of one magic fingerprint. Every live site leaks signals across a few repeatable categories, and the trick is to know what each one can and can't tell you. Once you get used to reading them together, the stack becomes much easier to classify.
Headers and source hints
HTTP headers often give the first hard clue. Server identifiers, framework hints, and CDN metadata can narrow the field before you open the DOM. On the HTML side, generator tags and framework-specific root elements can point toward a CMS or frontend runtime, but they're strongest when they line up with other evidence.
A practical example is the difference between a page that exposes a recognizable runtime marker in the markup and one that only serves a generic shell. The first tells you there's explicit framework plumbing on the page, while the second may only reveal itself once you inspect the client-side bundle. That's why source tags matter, but only as part of a broader chain.
JavaScript, CSS, and network traces
JavaScript bundles are often more revealing than visible markup. Chunk names, global variables, and source map references can expose the build system even when the rendered page looks generic. CSS class naming can also help, especially when utility-first patterns or component library signatures appear repeatedly across pages.
Network requests are where the stack starts to feel concrete. CDN domains, font loaders, analytics endpoints, and hosted script paths often expose the surrounding toolchain. Cookies fill in another layer, especially when a platform's session pattern or commerce tooling leaves a recognizable footprint.
If you want a practical bridge between frontend delivery and backend dependencies, the backend and frontend for JAMstack builds explainer is useful because it shows how the visible site and the supporting services can diverge.
The key habit is to read categories together. Headers tell you what responded, HTML tells you what was rendered, JavaScript tells you what was shipped, and network traces tell you what the page depends on in real time. That's the difference between a guess and a defensible identification.
Inspecting a Live Website Using Browser Tools
Open the page in Chrome, Edge, or Firefox, then go straight to developer tools. Don't start by searching the source blindly. Start with the network and document response, because that's where the browser already gives you the most useful evidence about what was delivered and how it was assembled.
Network first, then DOM
In the Network tab, reload the page and click the document request. Read the response headers, then scan the request list for script hosts, font CDNs, image services, and analytics endpoints. A site that routes assets through a platform-specific CDN leaves a different trace than one that self-hosts everything, and that difference often matters more than the visible design.
Next, move to the Elements panel and inspect the root structure. Look for framework-specific containers, predictable class naming, and whether the markup is heavy on static content or light until hydration completes. A site with a thin HTML shell and a lot of client-side rendering often behaves very differently from a traditional server-rendered page.
The board doesn't tell you everything in one place. You read the part number, the package, and the surrounding circuit together.
That same logic works here. A data-heavy page can still hide its identity unless you connect the DOM with the bundle graph and the request trail. For a structured way to think about the evidence, the EDA explained for 2026 piece is useful because it treats investigation as a process of gathering and comparing signals, not trusting the first one you see.
Sources, console, and version clues
The Sources tab is where bundle names, chunking patterns, and source maps show their hand. If you see readable original paths in a map file, that's a strong hint about the app's build structure, even when the production markup is compressed beyond recognition. The Console can also help, because many frameworks expose global objects that are easy to probe directly once you know what to look for.
Try checking the page for framework-specific globals and configuration objects. In some apps, the presence of an app-specific runtime object confirms what the HTML only hinted at. In others, the absence of those globals after hydration tells you the stack is either heavily customized or deliberately stripped of obvious markers.
A useful internal reference for the broader builder layer is how to detect website builder usage. Use that kind of guide after you've collected the live evidence, not before, because browser inspection usually gives you the parts that generic summaries miss.
Identifying Bundled Frameworks and AI-Generated Code
Bundled code is where most casual detection efforts get stuck. The visible site may look hand-coded, but the shipped assets often point to a framework, a component library, or an AI-assisted build pipeline. The goal isn't to name every dependency from one file. It's to recognize the recurring artifact patterns that show how the site was assembled.
Bundle signatures that actually matter
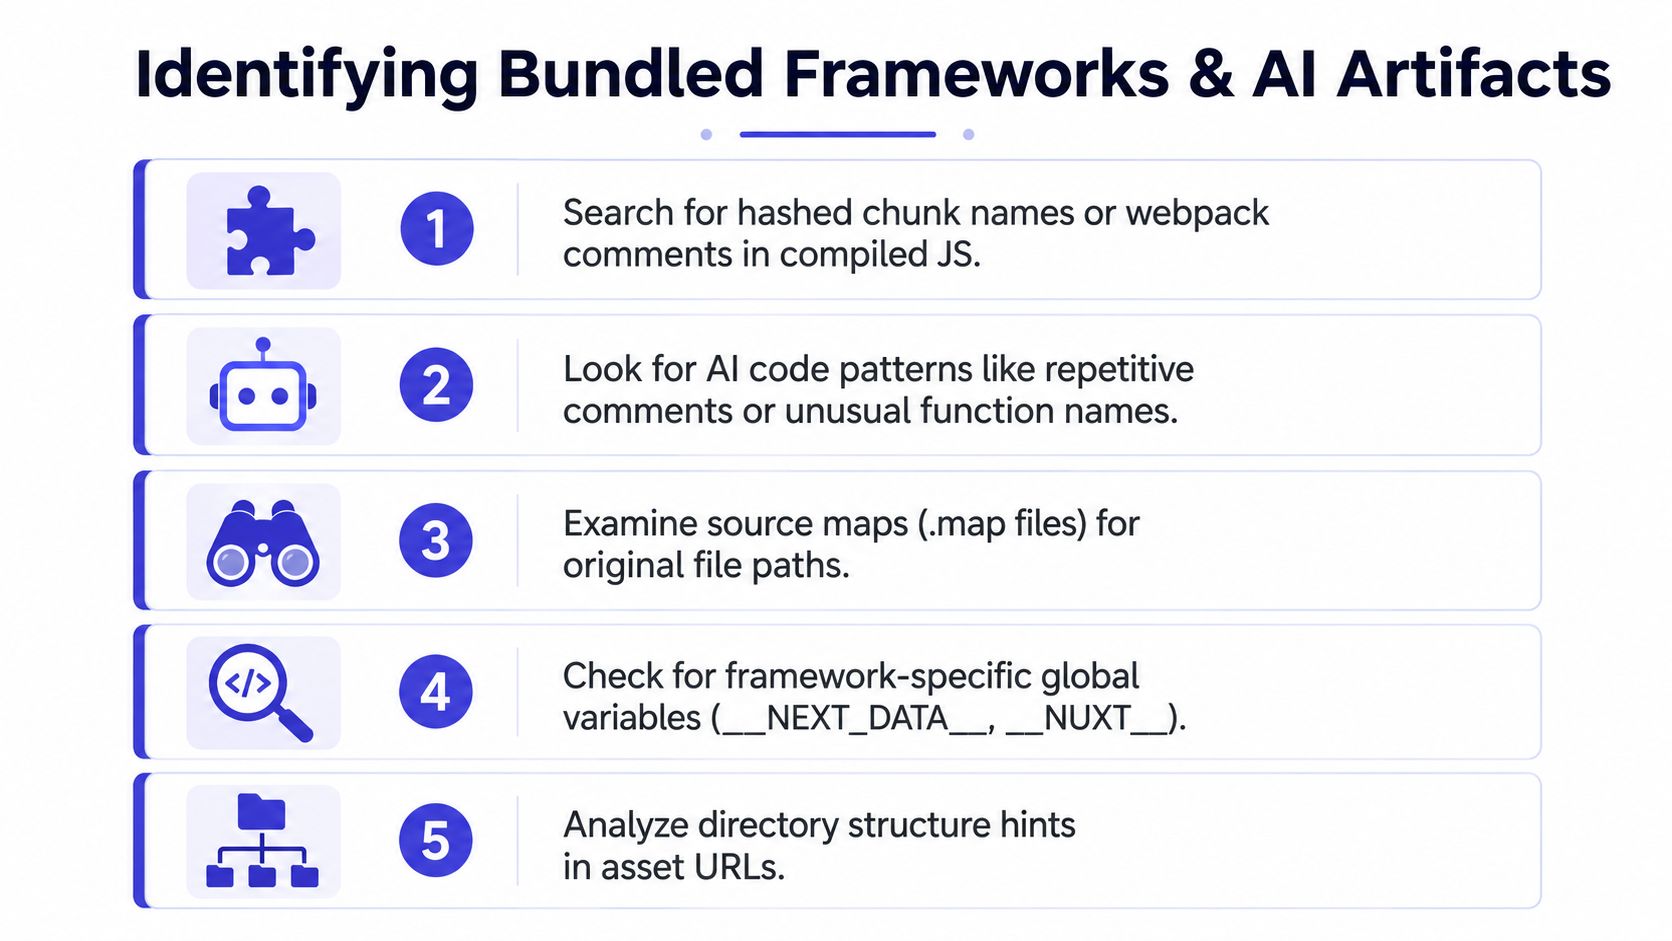
Hashed chunk names, framework comments, and source map references are the first things worth checking. They often survive minification in ways that class names don't. If you can see route-like file paths or chunk groupings that mirror an app's navigation structure, you're already closer to the build system than the homepage suggests.
Framework globals are the next layer. Some sites expose obvious runtime data objects, while others only reveal a partial footprint in the markup and bundle graph. A graph-based approach, like the kind discussed in code graph analysis for source code visualization, is useful here because relationships between files, modules, and assets often say more than isolated strings.
AI-assisted builds leave a composite signature
AI-generated or AI-augmented sites rarely announce themselves with one perfect marker. They tend to show a composite of familiar modern pieces, such as Next.js, Tailwind CSS, Shadcn UI, Lucide icons, and Radix primitives, all assembled into a polished but highly repeatable structure. That doesn't prove AI authorship by itself, but it does create a recognizable artifact cluster that deserves closer inspection.
Practical rule: don't try to prove “AI-built” from one component library. Look for the whole stack shape, the naming style, and the bundle behavior together.
If you're checking whether a site was generated by a builder, the most useful clue is often the combination of component structure and asset naming rather than visual style. A custom domain can hide branding, but it can't fully hide the way the bundle was assembled. That's why how to detect if a website was built with AI belongs in your workflow, especially after you've already inspected the live artifacts.
There's also a product-angle reason to care about this layer. AI Website Detector surfaces component architecture analysis, including UI library clues like Shadcn UI, Lucide, and Radix, along with bundle artifact detection, which makes it relevant when you need to separate a hand-built site from one assembled through modern AI tooling.
Building Confidence Through Multi-Signal Verification
A single signal can be right and still be misleading. That's why confident component identification depends on stacking evidence until the pattern stops being ambiguous. Strong signals tell you where to look, secondary signals confirm the shape, and tertiary signals help you catch edge cases like headless CMS setups or hybrid frontends.
Start with the strongest evidence
Explicit markers should anchor the first pass. If a site exposes a clear generator tag, a framework-specific global object, or a recognizable server fingerprint, that's the place to start. After that, check whether the HTML, bundle names, and request paths reinforce the same conclusion.
Conflicting clues deserve more attention, not less. A site can carry legacy cookies from one platform while serving a different frontend, especially in headless or edge-rendered architectures. In those cases, the safest move is to treat the older signal as supporting context rather than the final answer.
Use corroboration, then decide
Once the strongest signals line up, check the supporting layer. CSS naming, CDN domains, cookie names, and asset structure can all confirm the story or expose a false positive. You then distinguish between a custom build and an AI-builder output that only looks bespoke at first glance.
Three practical patterns show up a lot:
- Framer-like marketing sites: a clean, design-forward shell with consistent hosting and layout behavior that matches a managed builder rather than a handcrafted app.
- Headless commerce setups: storefront behavior that doesn't match the backend cookies at first glance, because the frontend and commerce engine are split.
- Custom builds versus AI output: similar visual polish, but different bundle repetition, naming conventions, and component reuse patterns.
The right verdict is the one that survives contradiction. If the site's headers, HTML, and bundles all point in the same direction, you can call it with confidence. If they don't, label it as uncertain and keep the evidence trail intact.
Turning Detection Into Actionable Intelligence
Component identification only matters if it changes a decision. Founders use it to sanity-check competitors, developers use it to understand how a build was assembled, marketers use it to validate positioning claims, and agencies use it to confirm whether a portfolio example is bespoke. The value isn't the label alone, it's the decision that follows from the label.
A simple workflow keeps the work repeatable. First, inspect the live page. Then record the strongest signal, the corroborating signals, and anything that conflicts. Finally, note your confidence and what would change your mind if you had to revisit the result later.
For batch research or portfolio screening, automated scanning can save time once you already know what signals matter. That's also where a tool like AI Website Detector fits, because it combines stack analysis with explainable signals so you can move from a guess to a documented verdict without starting from scratch each time.
If you're comparing multiple sites, keep the notes short and structured, then revisit the outliers manually. The sites that look simple are often the ones hiding the most layered implementation choices.
If you're trying to identify a website stack with less guesswork and more evidence, AI Website Detector gives you a live scan, explainable signal breakdown, and tech-stack clues you can use. Visit AI Website Detector and run a few real sites through it, then compare the results against your own manual inspection workflow.