AI Adoption Statistics: 2026 Trends & Impact
Global generative AI adoption reached 16.3% of the world's population in the second half of 2025, up from 15.1% in the first half of the year, according to Microsoft's AI Economy Institute. That is a gain of 1.2 percentage points in six months, and it reframes the AI conversation immediately. We are no longer talking about a niche productivity toy or a narrow enterprise experiment, we are looking at behavior that now touches roughly one in six people worldwide using generative AI to learn, work, or solve problems. For a market analyst, that matters because ai adoption statistics are only useful when they separate real usage from headline noise.
The central mistake in most adoption coverage is treating one number as if it describes everyone equally. It does not. Consumer use, employee use, and firm-level deployment sit at different stages of maturity, and the gap between them is where the story lives. The most useful reading of the data is not “AI is everywhere,” it is “AI is spreading fast, but value creation is still unevenly distributed.”
Table of Contents
- Global AI Adoption by the Numbers
- Enterprise Versus Consumer Adoption Patterns
- The Experimentation Versus Implementation Gap
- Geographic and Demographic Clustering of AI Usage
- Market Size Projections and Growth Trajectories
- How to Interpret AI Adoption Data for Decision Making
- What the Data Means for the Future of AI Integration
Global AI Adoption by the Numbers
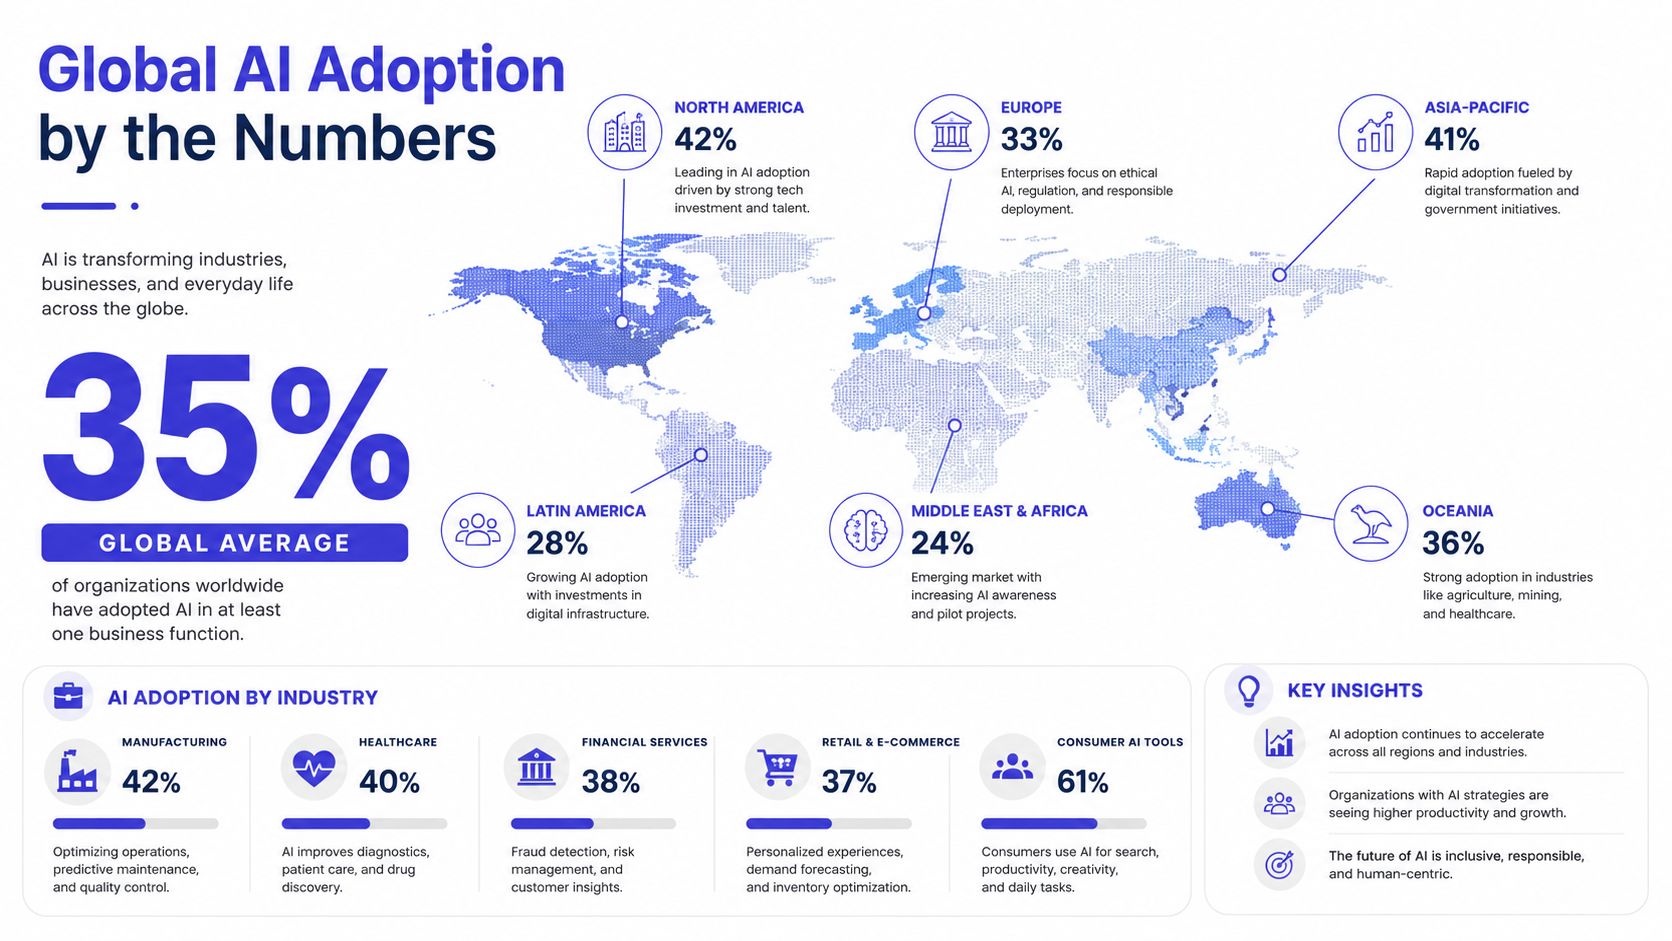
The clearest global signal is still consumer-scale usage. Microsoft's AI Economy Institute reports that 16.3% of the world's population used generative AI in the second half of 2025, up from 15.1% in the first half. That is not a rounding error. It shows momentum among ordinary users, not just enthusiasts or pilot teams. The report's own framing, roughly one in six people worldwide, is the right way to read the milestone because it captures AI as a mainstream behavior, not an abstract technology category. Microsoft's global AI adoption report for 2025
What the global number measures
The headline percentage is useful, but only if it is read precisely. It reflects generative AI use to learn, work, or solve problems, which is broader than enterprise adoption and narrower than saying AI is embedded in every workflow. That distinction matters because a consumer who asks a chatbot to summarize a document and a firm that inserts model output into production systems are not adopting AI at the same depth or for the same business purpose.
A board-level reading points to familiarity, not maturity. The technology has crossed into everyday use, but the same number does not show whether that use is casual, habitual, or embedded in revenue-generating processes. A single global percentage can therefore overstate operational readiness if it is used as a proxy for economic transformation.
Practical rule: treat global adoption rates as a signal of reach, not proof of impact.
Why the baseline matters for strategy
The main implication is that the market has already passed the “Can people use this?” phase in a meaningful share of the world. The harder question is now “Who uses it consistently, and for what?” Enterprise buyers, regulators, and product teams need to focus on that gap, because consumer uptake can move faster than organizational change.
For anyone benchmarking adoption, the global figure is a floor, not a ceiling. It shows AI is already part of routine behavior for a large and expanding user base, but it says little about whether companies have converted that behavior into process redesign, compliance controls, or measurable business value. For a broader view of how adoption patterns are being tracked across the market, AI Website Detector's market and usage trends is a useful reference point.
Enterprise Versus Consumer Adoption Patterns
Consumer adoption and enterprise adoption are moving at different speeds, and the gap is wider than most headlines suggest. In the United States, the St. Louis Fed found that generative AI use among adults ages 18 to 64 rose from 44.6% in August 2024 to 54.6% in August 2025, a gain of 10 percentage points in one year. Majority usage among working-age adults is now a reality, but that does not mean organizations have operationalized AI at the same pace. St. Louis Fed generative AI adoption in 2025
Large firms move faster than small ones
Enterprise adoption is highly uneven by size. In the EU, 19.95% of enterprises with 10+ employees used at least one AI technology in 2025, up from 13.48% in 2024, while the same source reports a large-firm versus small-firm gap of 55% vs 17%. That spread points to capacity constraints, not model scarcity. Larger firms have the data infrastructure, procurement discipline, and compliance teams to absorb AI faster, while smaller firms often lack all three. Global AI adoption index 2026
| Firm Size | Adoption Rate | Key Constraint |
|---|---|---|
| Large firms | 55% | Governance, integration, and data scale |
| Small firms | 17% | Limited capacity, data infrastructure, and compliance readiness |
The boardroom takeaway is blunt. “AI adoption” does not mean the same thing for a Fortune 500 company, a regional manufacturer, and a solo consultant. In a large firm, adoption can mean embedded systems, policy review, and workflow redesign. In a small business, it often means a few employees trying tools informally and without a formal rollout plan.
Survey design also changes the story
The St. Louis Fed's research on U.S. adults shows why methodology matters. Its earlier August 2024 estimate had initially been reported as 39.4%, but after revising question sequencing the updated estimate became 44.6%, which shows how survey design can materially shift reported adoption rates. Leaders often compare survey results as if they were interchangeable, when the wording may be measuring different behaviors. St. Louis Fed generative AI adoption in 2025
The cleanest comparison is this. Consumer adoption is now broad enough to create market familiarity, while enterprise adoption still depends on internal readiness. The result is a market where usage is widespread enough to matter, but uneven enough that strategy can still be won or lost on execution quality.
The Experimentation Versus Implementation Gap
Adoption headlines often overstate what is happening inside firms. One 2026 industry summary says 88% of organizations use AI regularly in at least one business function, yet only about one-third have moved beyond experimentation or pilot projects. The operational gap is the point. A pilot can show interest, but it does not yet change cost structure, cycle time, or decision quality. AI adoption statistics and trends overview
Usage is not the same as scaled value
The clearest evidence comes from NBER research on generative AI. It found that nearly 40% of U.S. adults ages 18 to 64 had used genAI by late 2024, while estimated genAI use accounted for only 1% to 5% of total work hours. The same research also reported that average time savings were modest when non-users were included. That combination matters because it shows how broad access can coexist with limited operational impact.
Many companies are still at the stage where AI helps people complete some tasks faster, not at the stage where AI reorganizes the business around new operating rules.
This is the difference between exposure and transformation. A team that uses AI for drafting emails, summarizing notes, or preparing internal material is using the tools in a real way. It has not yet necessarily changed pricing, service delivery, or product design. That distinction is why headline adoption rates can sound stronger than the underlying operating reality.
What to look for instead of adoption theater
A better framework is to ask where AI sits inside the work itself.
- Experimentation: Teams test tools informally and report anecdotal gains.
- Operational use: A function has repeatable tasks supported by AI, but exceptions and manual review still dominate.
- Scaled transformation: AI changes the process architecture, not just the interface.
Analysts at Stimulead's AI readiness assessment use this kind of maturity check to separate enthusiasm from readiness. The reason matters for capital allocation. A tool that saves a few minutes per task does not automatically justify redesigning workflows, retraining staff, or changing governance. Many organizations report “adoption” when they really mean exposure, and those are different stages of maturity.
Geographic and Demographic Clustering of AI Usage
AI usage is clustering inside countries, not just between them. Recent evidence shows that adoption is increasingly concentrated in large metro areas, technology corridors, and university-centered communities in the United States, while Europe shows a broad-use pattern that still thins out when you look specifically at work. The European Commission's 2026 survey found that about 54% of Europeans use AI, but only about one in four uses it for work. That split is the point, because it separates general familiarity from labor-market integration. Microsoft US AI diffusion report 2026
Where adoption clusters
This pattern creates a hidden adoption divide inside wealthy economies. People in regions with dense tech employment, research universities, and digital-native firms are more likely to move from curiosity to routine use. People in other regions may still be aware of AI, but they are less likely to fold it into daily work. The consequence is that national averages can hide strong local concentration.
That matters for market planning. If adoption is clustering in a handful of metro areas, then sales, hiring, and product feedback will also cluster there. Companies that rely on national averages can miss the fact that the highest-intensity usage is often concentrated where digital work is already dense.
Why demographic context changes interpretation
Averages also hide who is doing the adopting. The U.S. diffusion evidence points to concentration across specific regions and communities, not uniform spread across the labor force. In practice, that means the same “adoption rate” can describe very different realities depending on age, industry, education, and geography.
Decision rule: if a statistic does not tell you where adoption is happening and whether it is used for work, it is not enough for investment or workforce planning.
The European and U.S. evidence together point to the same conclusion. AI is not diffusing like a uniform utility. It is spreading through pockets of high readiness first, then moving outward more slowly. That creates opportunity for vendors and employers, but it also creates a risk of overestimating how representative the front-runners really are.
Market Size Projections and Growth Trajectories
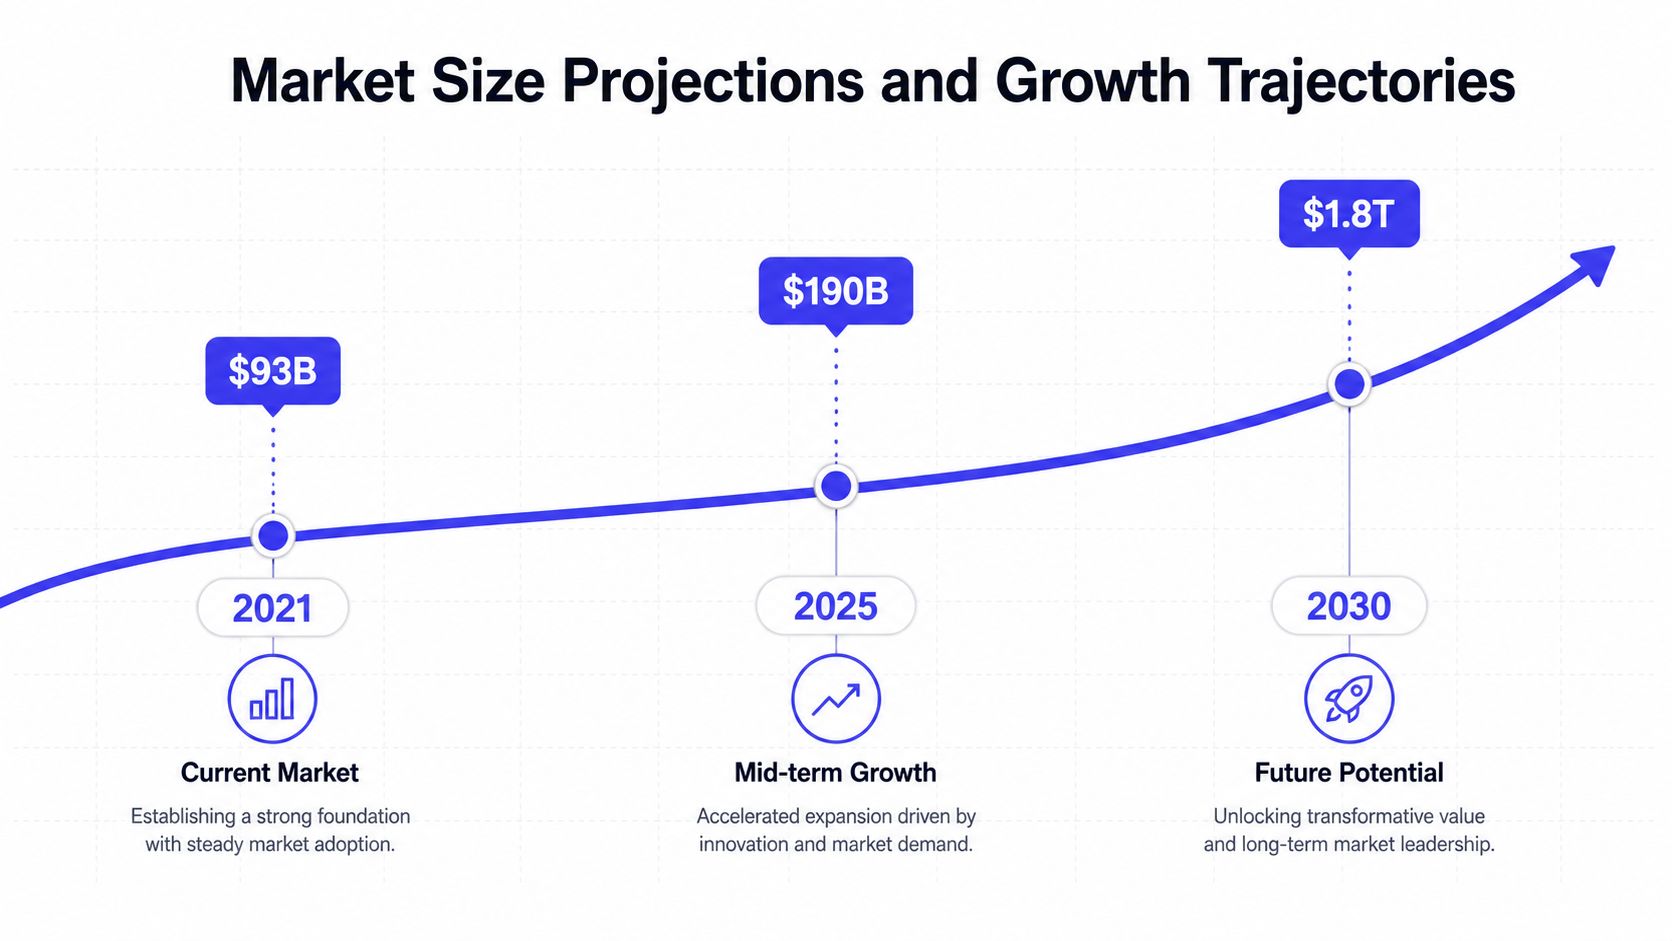
The market is large enough to make the adoption debate financially unavoidable. A widely cited 2025 estimate places the global AI market at $391 billion in 2025, with projections to reach $1.81 trillion by 2030. That implies roughly 4.6x growth over five years, which is a strong signal that infrastructure, software, and services spending will keep rising even while implementation remains uneven. Global AI market size trends
What the market trajectory actually says
Market size is not adoption quality, but it does show commitment. A multi-trillion-dollar path means vendors, cloud providers, and enterprises are allocating budget as if AI will become part of the normal technology stack. The more important point is that spending can rise ahead of full operational maturity. In other words, the market can be optimistic long before the average company gets good at using the tools.
That makes the market look less like a hype spike and more like a long integration cycle. Buyers are still experimenting, but infrastructure and software investment are already pricing in broader deployment. The result is a market where the commercial ecosystem may mature faster than end-user workflows.
Where adjacent sectors fit
For adjacent industries, the implication is immediate. Insurers, for example, are already facing questions about underwriting, automation, and governance that depend on broader AI diffusion across clients and vendors. A useful external reference on this is the evolving AI landscape for insurers, which helps contextualize how sector-specific requirements move alongside market growth rather than after it.
If you are tracking implementation from the vendor side, it also helps to compare market growth with platform concentration. The AI builder market share view is a practical way to understand how adoption pressure is distributed across tools and stacks. The signal is not just that the market is expanding, it is that different parts of the ecosystem are expanding at different speeds.
How to Interpret AI Adoption Data for Decision Making
The first rule is to ask what kind of adoption you are looking at. Consumer usage, worker usage, and firm-level deployment answer different questions, and they should not be merged into a single management dashboard. If a vendor presents a high adoption percentage without defining the unit of measurement, the number is usually less useful than it looks. AI adoption insights
A practical reading checklist
Use the following questions before you trust any AI adoption statistic.
- Who is being measured: consumers, workers, or firms.
- Where it is measured: country-wide, regional, metro-based, or sector-specific.
- How the survey asks: broad business-function use, narrow production use, or self-reported familiarity.
- What stage it captures: experimentation, operational use, or scaled transformation.
- Whether the number implies value: usage alone does not prove productivity or revenue impact.
That checklist matters because methodology changes outcomes. The St. Louis Fed example shows that even minor survey-sequencing changes can move adoption estimates materially. So a credible analysis should always ask whether the statistic reflects actual behavior, a broader survey frame, or a narrow function-specific definition.
The strongest inference comes from gaps
The best adoption data is usually the data that exposes a gap. If consumer use is rising fast but firm deployment remains shallow, that tells you where workflow redesign is lagging. If adoption is concentrated in certain regions or large firms, that tells you where competition, hiring, and vendor demand will cluster next.
For founders and product managers, the right question is not “Is AI adopted?” It is “Where is adoption mature enough to change buying behavior, and where is it still a trial?” That is the difference between building for curiosity and building for operational demand. If your own team needs a structured way to pressure-test readiness, it's worth comparing internal assumptions with assess your AI capabilities, especially when adoption claims are driving roadmap decisions.
What the Data Means for the Future of AI Integration
The near-term future looks less like a single AI wave and more like uneven integration. The data shows broad consumer familiarity, stronger usage in large firms than small ones, and persistent concentration in high-readiness regions. That means the next stage of AI growth is likely to be defined by who converts experimentation into repeatable operating practice, not by who merely tries the tools first.
A boardroom should read that as a talent and process story, not just a software story. Regions and firms already using AI for work will attract more vendors, more specialists, and more internal investment. Meanwhile, organizations stuck in pilot mode will keep reporting adoption without seeing much structural change. The gap will not close on its own, because the limiting factors are capacity, governance, and implementation discipline.
The clearest strategic conclusion is that AI adoption is now deep enough to matter, but uneven enough to reward execution. The companies that win in 2026 and beyond will not be the ones that can point to the highest adoption headline. They will be the ones that can prove where adoption changed a workflow, a cost base, or a customer experience.
If you need a way to separate real AI adoption from marketing language on live websites, visit AI Website Detector. It helps you verify what a site was built with, which is the same discipline this topic demands. When adoption claims start to blur into hype, use a tool that makes the underlying stack visible.