
How to Analyze Website Tech Stack the Smart Way
You're on a competitor's homepage, a vendor just claimed their build is “custom,” or a site you admire feels too polished to be guesswork. The next question is the one that matters, what's underneath it? If you want to analyze website tech stack in a way you can defend, you need evidence, not a lucky lookup. The useful answer usually comes from several signals at once, and that's the mindset that separates a quick label from a real technical read.
Table of Contents
- Why You Need to Look Under the Hood
- The Core Toolkit You Need Before You Start
- Six Layers of Evidence to Pull From Any Site
- Reading AI-Builder and Vibe-Coded Footprints
- Where Detection Breaks Down and How to Stay Honest
- A Repeatable Workflow From URL to Verdict
- Quick Checklist Before You Trust Any Finding
Why You Need to Look Under the Hood
A founder comparing a rival's site is rarely trying to admire typography. The core question is whether the competitor runs on WordPress, Shopify, Webflow, a modern JavaScript framework, or a custom build that would be expensive to duplicate. A marketer asking the same thing wants to see what sits behind the conversion flow, while an agency may need to verify whether a client's “custom platform” claim holds up. A structured review beats a casual guess, especially when you need to compare vendors or benchmark a market.
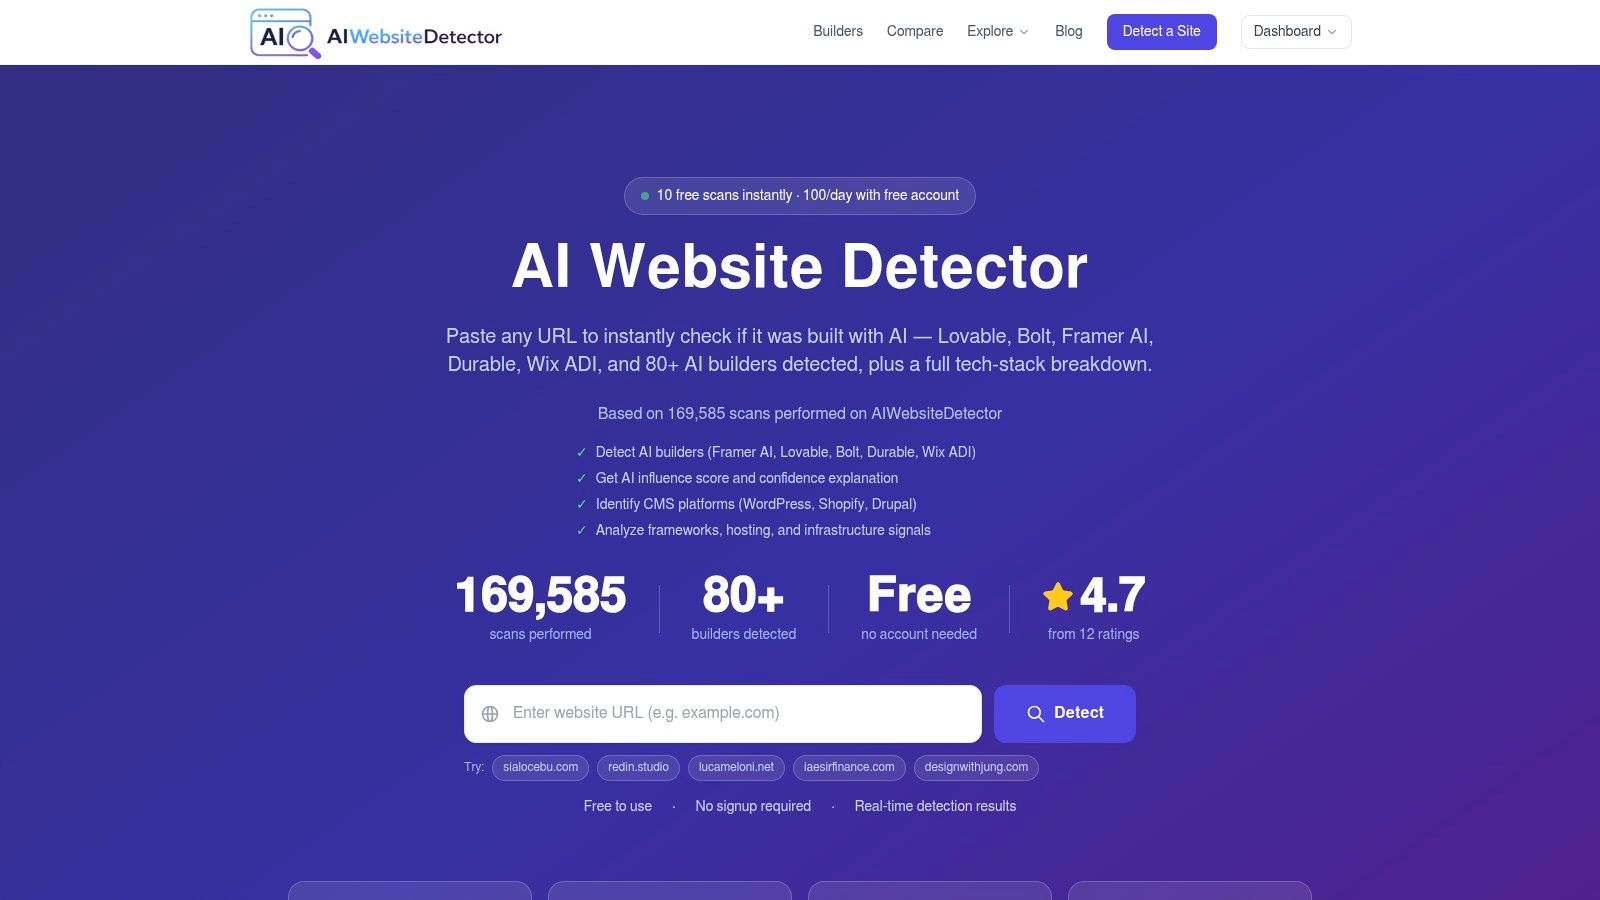
A useful starting point is a resource that helps review platform development layers, because stack analysis works better as layered evidence than as a single badge on a homepage. Once you treat a site as a bundle of signals instead of a mystery box, the quality of the conclusion improves quickly. A tool like AI Website Detector's stack analysis overview follows the same logic, since one site can expose several technology layers at the same time.
Practical rule: if the only thing you know is the CMS label, you do not know enough yet.
The market has already moved past single-signal guessing. Contemporary analyzers inspect HTML, scripts, meta tags, HTTP headers, CSS, JavaScript, network requests, and cookies, and some systems report hosting, analytics, security, payments, and deployment together instead of flattening everything into one answer. The better way to analyze website tech stack is to ask which signals agree, which ones conflict, and which ones deserve skepticism when the page is obfuscated.
The Core Toolkit You Need Before You Start
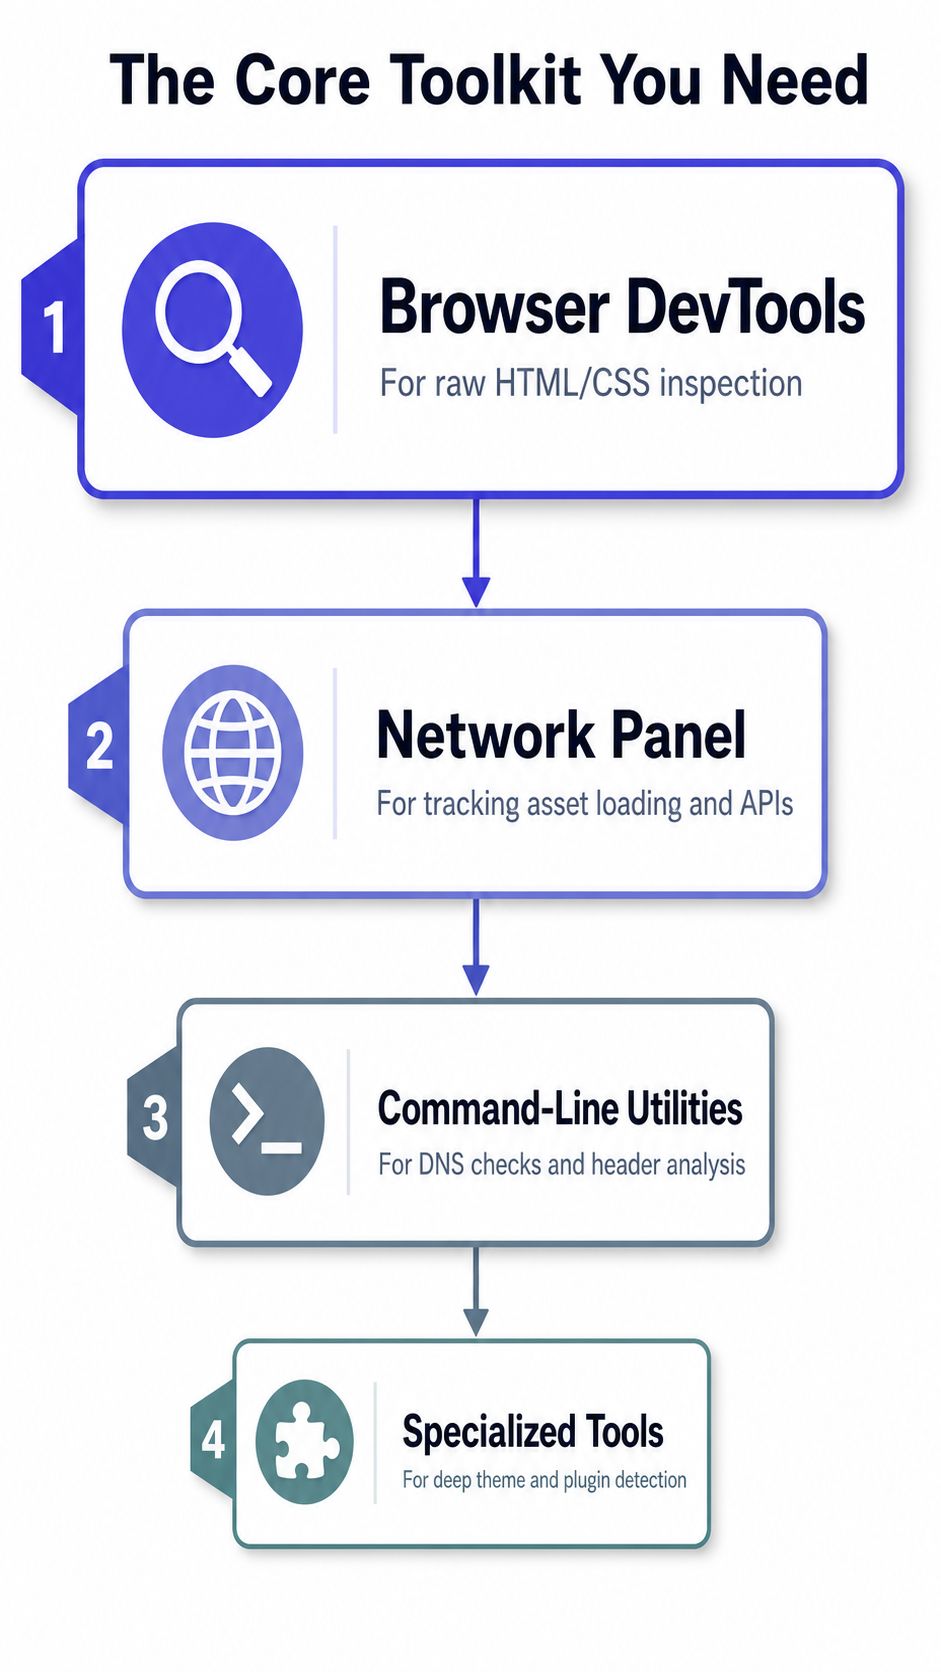
A solid stack review starts with browser DevTools. The Elements panel exposes raw HTML and class names, the Sources panel shows script paths, and the Network panel shows what loaded during the visit. That gives you a fast read on visible fingerprints, but DevTools only reflects what the browser received. It will not fully explain server-side rendering, edge logic, or the layers a CDN hides before the page reaches you.
For origin and response checks, use command-line utilities. Headers often reveal a layer that frontend inspection misses, especially when a site sits behind a proxy or CDN and the visible app is only part of the picture. The trade-off is simple. Headers can be stripped, rewritten, or made deliberately generic, so they help most when you already have another signal to compare them against.
A specialized multi-signal scanner fills in the gaps. Public tool descriptions show a scan model that pulls HTML, JavaScript, CSS, network requests, and headers together, then groups results by category and shows the matching artifact. One public example describes a ruleset with over 100 declarative rules and records the exact pattern or header string that matched, which keeps the result auditable instead of opaque (technology stack analyzer reference). That level of explainability matters when you need to show a client or teammate why a detector reached a specific conclusion.
A single tool still misses edge cases, so the stack review workflow should stay layered. Manual inspection helps verify what the page exposes directly, a scanner helps consolidate evidence, and tools like AI Website Detector help compare signals across a mixed stack without forcing everything into one label. For broader page discovery before you inspect a site, How to crawl every site page is useful because hidden templates and subpages often carry stronger fingerprints than the homepage. If you also need a quicker pass over site structure before opening DevTools, the sitemap checker can point you toward the pages most likely to expose the underlying build.
Six Layers of Evidence to Pull From Any Site
The most reliable workflow starts with the page itself, then widens outward. A single clue is cheap to fake. Two independent clues are harder. Three or more, pulled from different layers, usually tell a story you can trust.
1. HTML source
Look for meta generator tags, comments, class names, and template hints. A WordPress page might expose generator metadata or theme-related class naming, while a custom app may reveal framework conventions instead. Source comments are useful too, but they're not sacred. Teams leave stale comments, plugins inject markup, and templates can make a site look more standardized than it really is.
2. Script and stylesheet paths
Asset paths often tell you more than the visible page does. A script loaded from a recognizable framework bundle, a stylesheet served from a known CDN, or a naming pattern tied to a platform can be very strong evidence. Still, a marketing script or page builder widget can sit on top of a custom core, so path clues should be treated as supporting evidence, not a final verdict.
3. JavaScript globals
Frameworks often leave window objects, runtime flags, or build-time markers behind. That's where you catch signs of React, Next.js, Vue, or another frontend layer that won't always show up in static HTML. The catch is that globals can be minimized away or only appear after interaction, so they're best confirmed with another source.
4. Cookies and tracking pixels
Cookies can identify analytics, support, personalization, or ecommerce tooling. Tracking pixels often expose marketing infrastructure, even when the main site is carefully branded to look “minimal.” These signals are useful because they often survive design changes, but they can also be added by a plugin or tag manager, so they're rarely enough on their own.
5. HTTP response headers
Headers like Server or X-Powered-By are fast to inspect and sometimes highly revealing. They can confirm hosting layers or framework families when the rest of the page is ambiguous. They can also be hidden, rewritten, or normalized by proxies, which makes them valuable but fragile.
6. Network request patterns
Open the Network panel and watch what happens during load and interaction. API calls, third-party pixels, payment requests, and script fetches tell you how the site behaves after the first paint. If you're trying to map the full site rather than just the homepage, this layer is where you see the complete operational stack.
For broader page discovery, a crawler can help before you inspect assets. How to crawl every site page is useful context when you need more than the landing page, and the internal sitemap checker can help you move from one URL to a fuller inventory without guessing what the site exposes.
Save the artifacts every time, the source snippet, the header dump, the suspicious asset URL, and the network request that matched. Then cross-reference at least two layers before you write down a conclusion.
Reading AI-Builder and Vibe-Coded Footprints
AI-shaped sites are no longer a niche curiosity. Some are built with AI-native platforms like Framer, Lovable, Bolt, Durable, Wix ADI, and 10Web. Others are more subtle, where a human developer uses tools like Cursor or v0 and ships a stack that looks like Next.js + Tailwind CSS + shadcn/ui + Lucide + Radix. Those two cases don't mean the same thing, and the difference matters when you're analyzing competitor velocity or verifying a vendor claim.
What to look for in the evidence
Bundle artifacts matter most here. A compiled JavaScript bundle may still leak builder identifiers, theme markers, or framework-specific assembly details. Exposed globals can also help, especially when a site has a signature runtime pattern that matches the builder or the frontend framework. Meta tags and comments are weaker, but they can still be useful when they reference the generator directly.
Practical rule: the strongest AI-builder signal is the one buried in compiled output, not the one pasted into visible page metadata.
Confidence has to stay probabilistic. A site that looks “AI-built” from one source may just be using a popular component library or a fast-moving starter template. A site that looks hand-coded might still have been assembled from AI-assisted snippets. That's why verdict labels should separate AI-Native Build, AI-Augmented Development, Modern AI-Compatible Stack, Manual/Custom Build, and Traditional Architecture rather than collapsing everything into one yes-or-no answer.
There's a real due-diligence angle here. If you're evaluating a portfolio site or a vendor pitch, “AI-built” and “AI-assisted” change the story you tell internally. The site may still be effective either way, but the production process, maintainability, and likely velocity can be very different. A scanner that explains the evidence behind the label is much more useful than one that only gives you a score.
Where Detection Breaks Down and How to Stay Honest
The failure modes are predictable once you've looked at enough sites. CDN masking can hide the origin server. Server-side rendering and partial hydration blur the line between static and dynamic behavior. Minified bundles remove the comments and symbols that used to make fingerprinting easy. And marketing scripts can impersonate core architecture if you don't separate what the site is from what the site loads.
That's why signal resilience matters more than signal abundance. Headers are easy to hide. Meta tags can be absent or generic. Bundle artifacts can be split, renamed, or compressed until they look meaningless. A single obvious marker, especially one added by a plugin or template, can push you into the wrong conclusion if you don't ask what corroborates it.
A few common edge cases are worth keeping in mind.
- Cloudflare Worker in front of a custom Node app: the visible edge can look standardized while the core application stays custom.
- Heavily customized WordPress: the theme may be so modified that the stack looks hand-rolled unless you inspect deeper.
- Vite-built SPA served from one domain: the whole site can appear deceptively simple while the runtime stack remains layered.
The fix is simple, even if the work isn't glamorous. Treat the first clue as a hypothesis, not a verdict. If a signal can be faked by a plugin, template, or CDN, require at least one corroborating artifact before you trust it. That rule saves you from overcalling a stack when the site is designed to look cleaner than it really is.
A Repeatable Workflow From URL to Verdict
A repeatable stack check starts with the page, not the label. Open the site, run a multi-signal detector, and capture what the browser exposes in source, headers, network calls, and loaded assets. If the first result looks unusually certain, run a second scanner and compare the overlap. A tool like the website tech stack detector helps here because it gives you a structured starting point, but the final verdict still depends on whether the signals agree under manual inspection.
Decision rules that hold up
Core agreement matters more than broad agreement. If two scanners match on the CMS but drift on analytics or hosting, that usually points to a harmless detection difference. If they disagree on the framework, runtime, or front-end build path, go back to source and headers before you write anything down. One clue is not enough when that clue could come from a plugin, a tag manager, or a CDN rule.
If a signal can be spoofed, treat it as provisional. A comment in the HTML, a vendor script name, or a generic platform marker can be useful, but only if another artifact supports it. Without that second layer, mark the finding as unconfirmed or inconclusive and keep moving.
| Approach | Best For | Main Limitation | Evidence Depth |
|---|---|---|---|
| Single-Source Detector | Fast first-pass checks | Easy to misread or overtrust one clue | Shallow |
| Multi-Signal Scanner | Competitor research and vendor verification | Still needs manual confirmation on edge cases | Deeper, auditable |
Keep a short verdict note with the supporting artifacts, then stop. A clean conclusion backed by source lines, header values, or network traces is more useful than a louder claim you cannot defend later.
Quick Checklist Before You Trust Any Finding

Before you act on a stack finding, check two independent layers at minimum, save the matching artifacts, and flag anything that came from a single clue. Revisit the result if the site changes, because the evidence can shift with a redesign, a new CDN rule, or a framework migration. The field is also moving toward deeper AI-influence scoring, bundle-artifact forensics, and broader infrastructure fingerprinting, so the bar for evidence is only getting higher.
The best analysis is the one a skeptical engineer won't laugh out of the room. If you can show the source, the header, and the network call that support your conclusion, you're doing it right.
A CTA for AI Website Detector.